Master the Best Day Trading Indicators for Beginners
Hey there! If you’ve just dipped your toes into the wild world of the stock market, you’re probably feeling a mix of excitement and total overwhelm. Trust me, I’ve been exactly where you are. You load up your very first stock chart, and suddenly it looks like a toddler got hold of a box of neon crayons and scribbled all over your screen. Those lines, bars, and squiggles? Those are day trading indicators.
Learning how to use the right day trading indicators is one of the most important steps you can take to become a consistently profitable trader. You don't need a hundred different lines crossing on your screen to be successful. In fact, too many tools will just freeze you up. You simply need a reliable, focused system that helps you cut through the noise, understand market momentum, and spot prime entry and exit points.
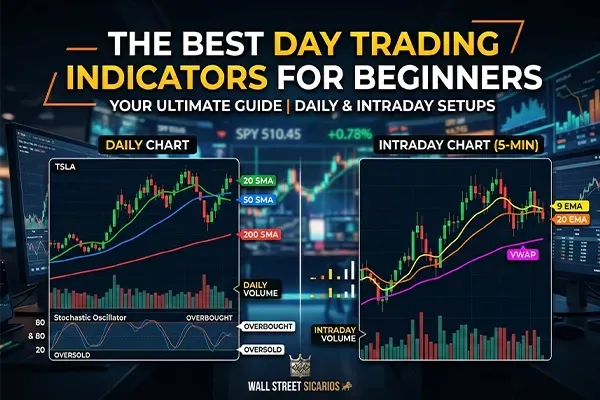
In this guide, we are going to break down the absolute best day trading indicators for beginners. We are going to keep it incredibly simple and highly actionable by splitting our focus into two areas: the Daily Chart (to find the big picture) and the Intraday Chart (to pinpoint your exact trades). No confusing Wall Street jargon—just real talk between friends. Grab a cup of coffee, and let’s get into it!
What Are Day Trading Indicators and Why Use Multiple Timeframes?
Before we jump into the specific setups, let’s talk about what day trading indicators actually are. Simply put, they are visual math. They take raw data—like historical price and volume—and turn it into visual lines or histograms on your chart, giving you clues about where the price might go next.
Think of them like the dashboard on your car. You don't need to stare at your speedometer or the gas gauge every single second to drive, but glancing at them helps you avoid getting a speeding ticket or running out of gas on the highway. Similarly, day trading indicators help keep you safe.
To use them effectively, the pros use a method called "Top-Down Analysis." This means we look at the big, slow Daily Chart to figure out the overall story of the stock, and then we zoom into the fast Intraday Chart (like the 1-minute or 5-minute chart) to actually pull the trigger on a trade. You can learn more about building this foundational habit in our guide on how to master top-down analysis for beginners.
Let's start by setting up your Daily Chart.
The Daily Chart: Setting the Stage with Day Trading Indicators
Your daily chart is your roadmap. Every single candlestick represents one full day of trading. We use specific day trading indicators on this timeframe to find strong stocks to put on our morning watchlist. Here are the exact tools you need on your daily chart:
1. Volume (The Foundation) Volume is the absolute heartbeat of the market. It represents the number of shares traded during a given day. When you look at the bottom of your chart, you’ll see vertical bars representing this volume. If a stock is breaking out to a new high, you want to see it accompanied by a massive spike in daily volume. This tells you that big money (institutions) are buying. Low volume breakouts are often traps.
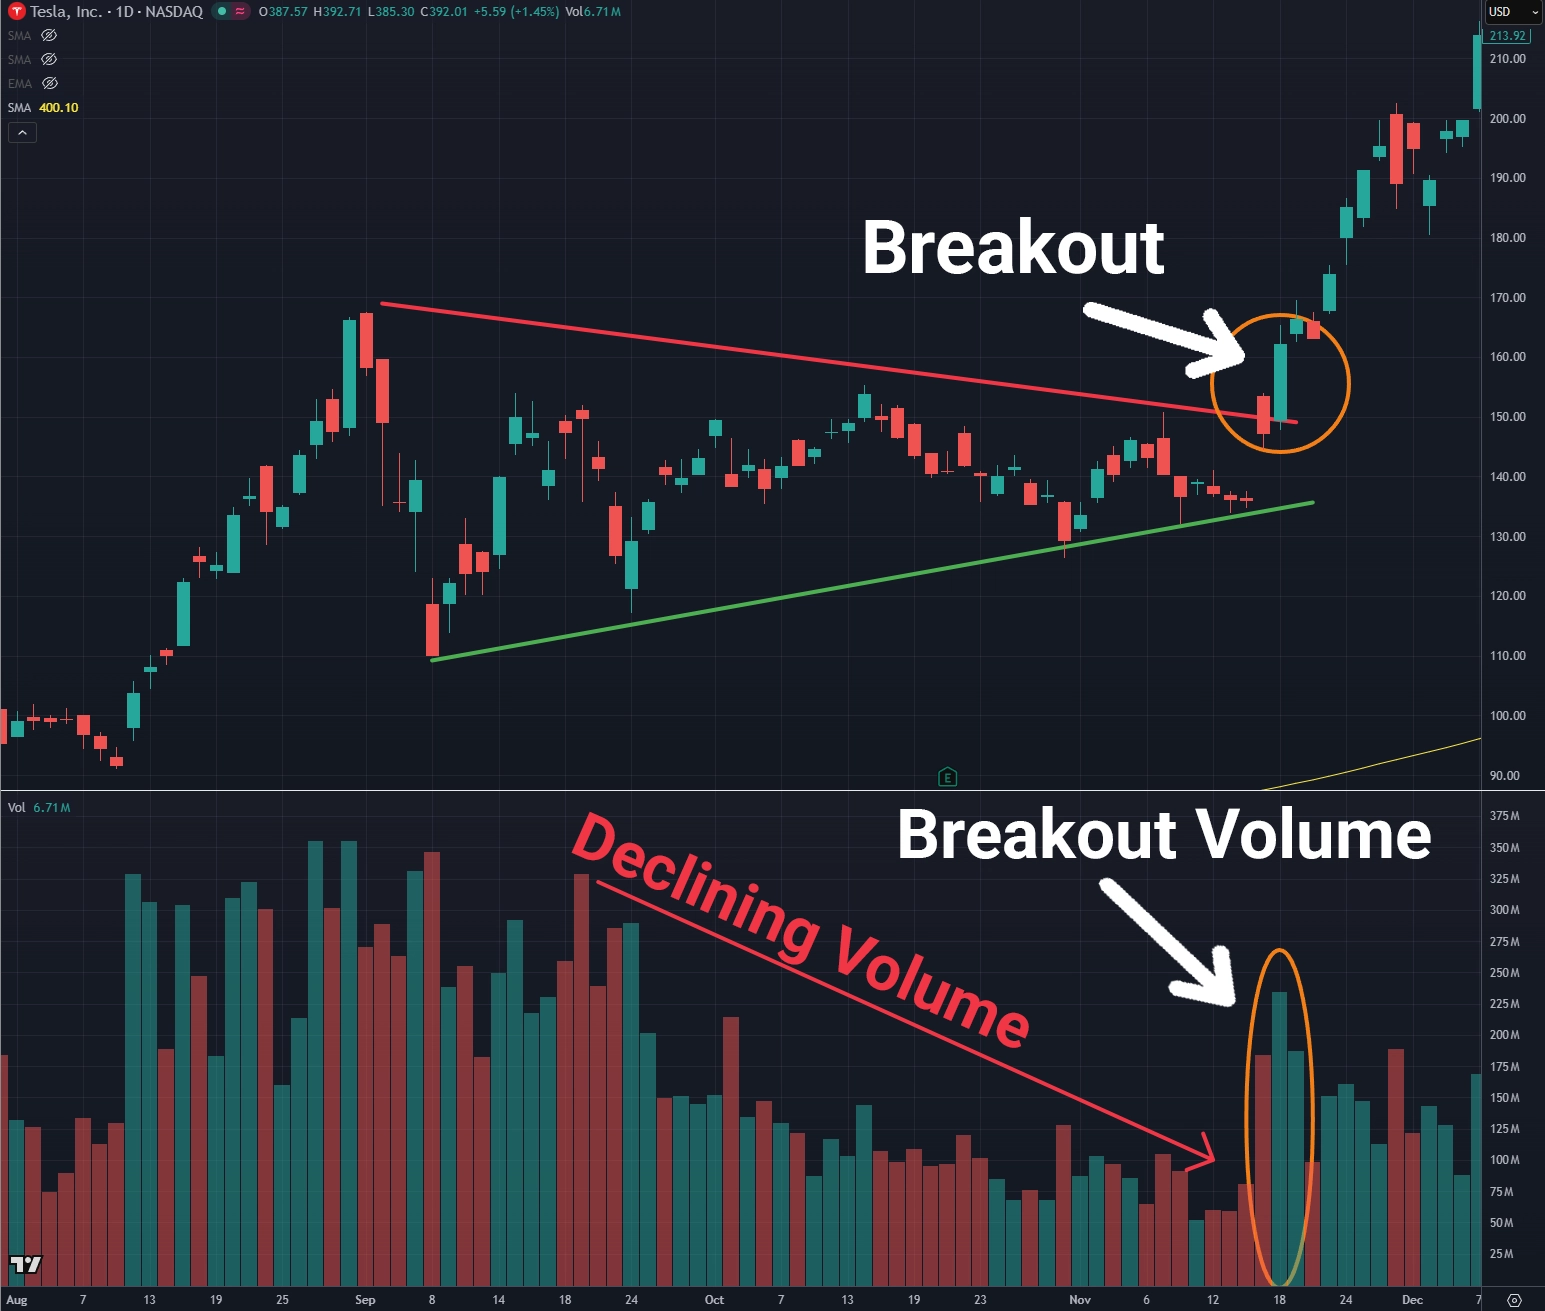
(A daily stock chart demonstrating volume day trading indicator confirming a breakout)
2. The 20, 50, and 200 Simple Moving Averages (SMAs) Moving averages smooth out choppy price action to reveal the true trend. For your daily chart, you strictly want to use the 20 SMA, 50 SMA, and 200 SMA. These are lines that calculate the average closing price over the last 20, 50, or 200 days.
The 20 SMA: This is your short-term trend line. If the daily price is above the 20 SMA, the stock has great short-term momentum.
The 50 SMA: This is the mid-term trend. It is heavily watched by institutional investors. When a stock pulls back to its daily 50 SMA, it often finds major support as big funds step in to buy.
The 200 SMA: This is the granddaddy of them all. It defines the overall, long-term health of a stock. If a stock is below its 200 SMA on the daily chart, it is in a massive downtrend, and many professional traders will simply refuse to buy it.
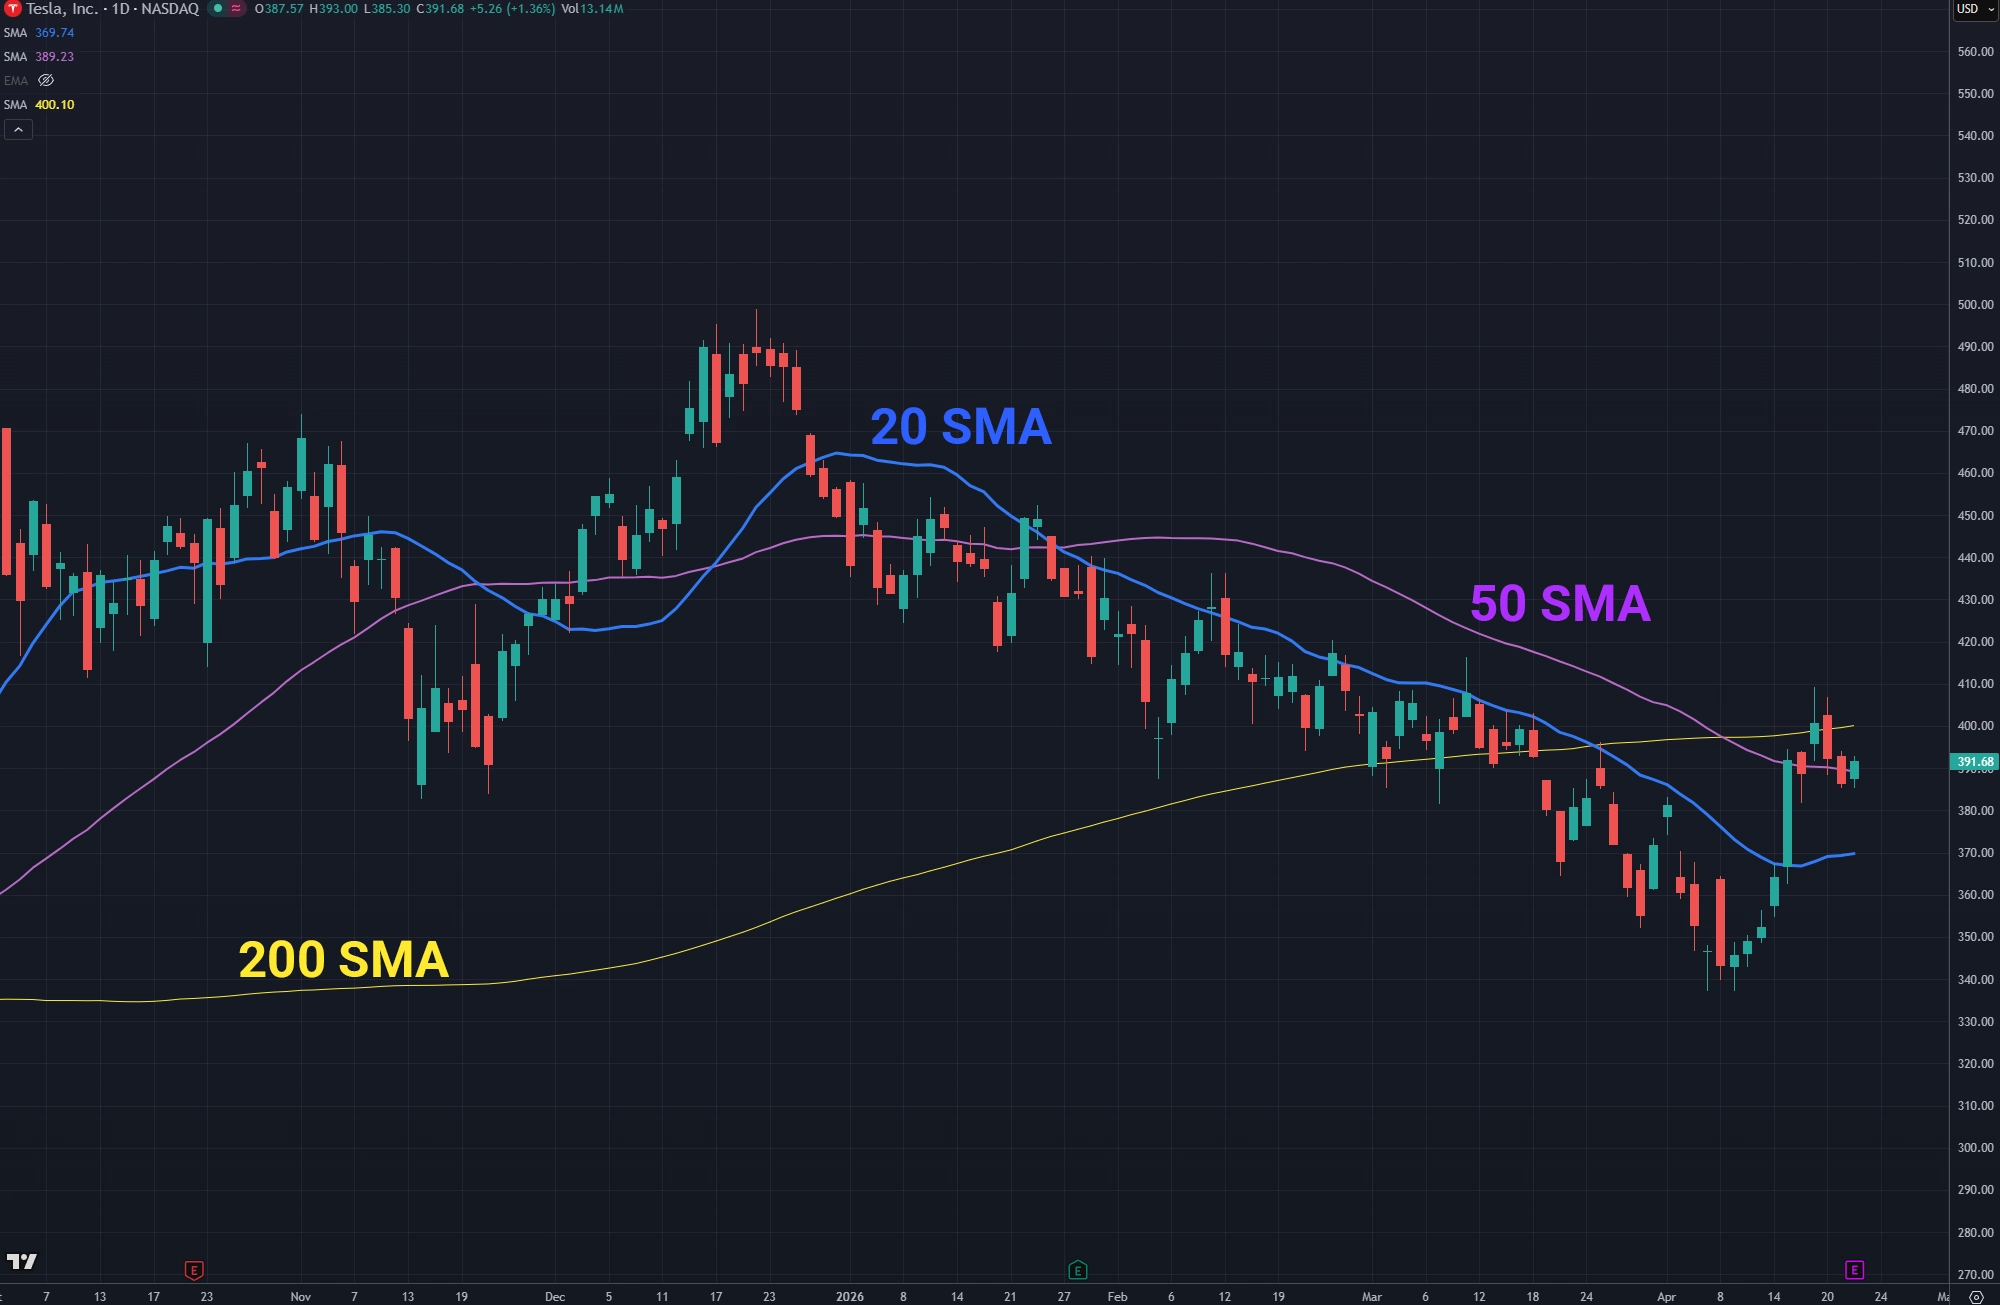
A daily stock chart showing the 20 SMA, 50 SMA, and 200 SMA plotted on the chart with labels.
3. Stochastics (Spotting the Turn) To round out your daily chart, we use an oscillator called the Stochastic Oscillator (or just Stochastics). This tool helps you see if a stock has been pushed too far, too fast over the last few weeks. It moves between a scale of 0 and 100.
Overbought (Above 80): When the Stochastics indicator pushes above 80 on the daily chart, the stock is getting overextended. It doesn't mean it will crash today, but it means a pullback is likely brewing.
Oversold (Below 20): When it drops below 20, the sellers are exhausted. The stock might be primed for a bounce.
Combining the 50 SMA with an oversold Stochastics reading is a classic way to find stocks ready to bounce. For a deeper, textbook dive into the math behind this tool, Investopedia has a fantastic breakdown of the Stochastic Oscillator.
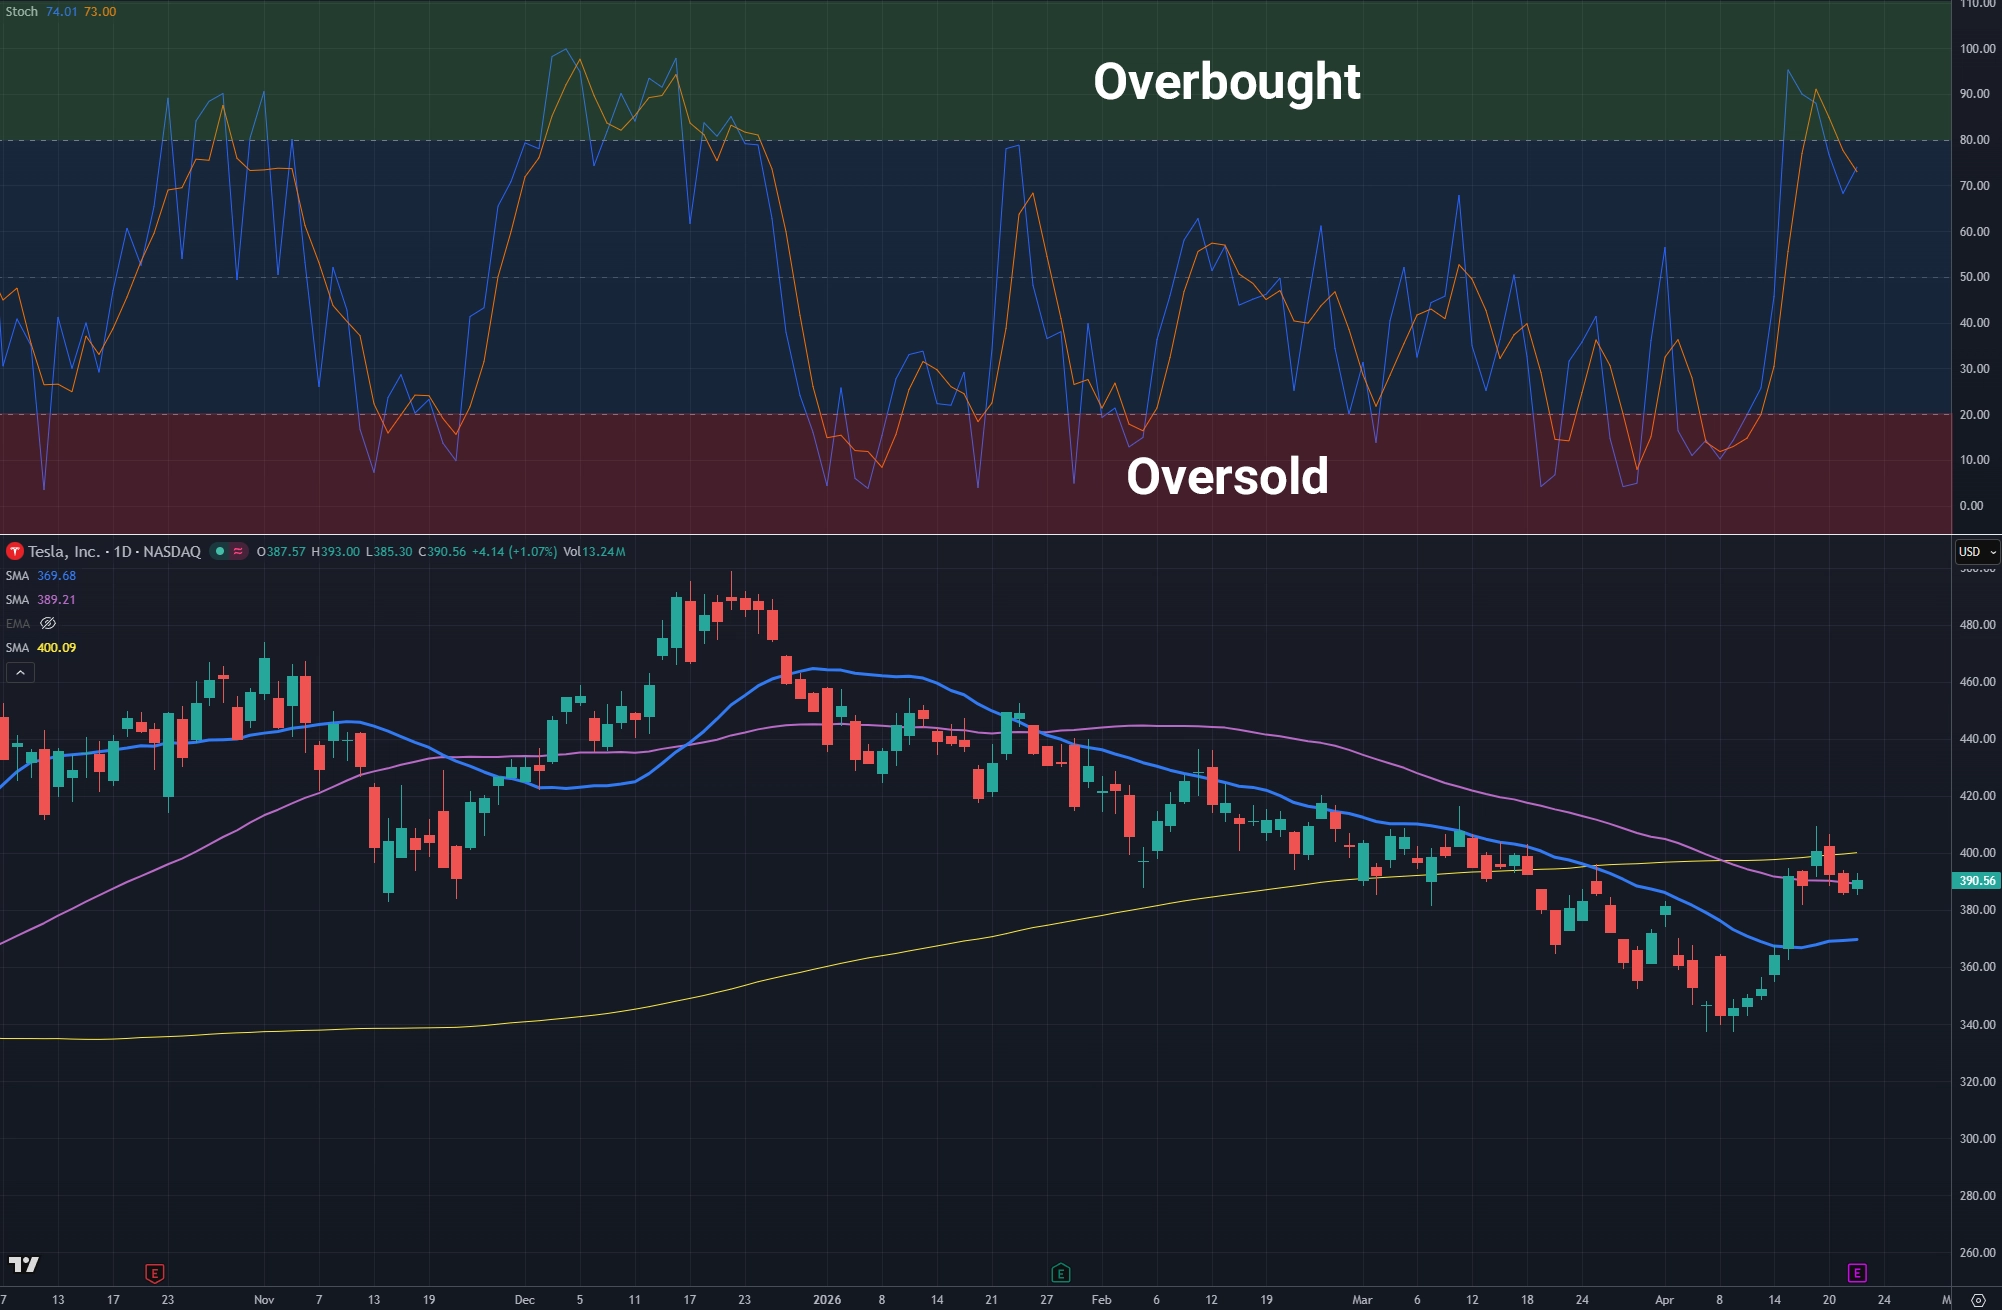
Stochastics indicator plotted on stock chart with Overbought and Oversold levels labeled.
The Intraday Chart: Precision Day Trading Indicators
Okay, you’ve checked your Daily Chart and found a stock that looks incredibly bullish above its 200 SMA with great daily volume. Now the opening bell rings. It’s time to zoom into the intraday chart (like the 1-minute or 5-minute timeframe).
Here, the game moves much faster. The daily day trading indicators are too slow for fast-paced action, so we swap them out for tools built for speed.
1. Intraday Volume Just like on the daily chart, volume is your truth-teller. If a stock suddenly spikes at 10:00 AM, glance down at the volume bars. If the bar is tiny, it's fake movement. If the volume bar is towering over the others, real money is moving the stock, and it's time to pay attention.
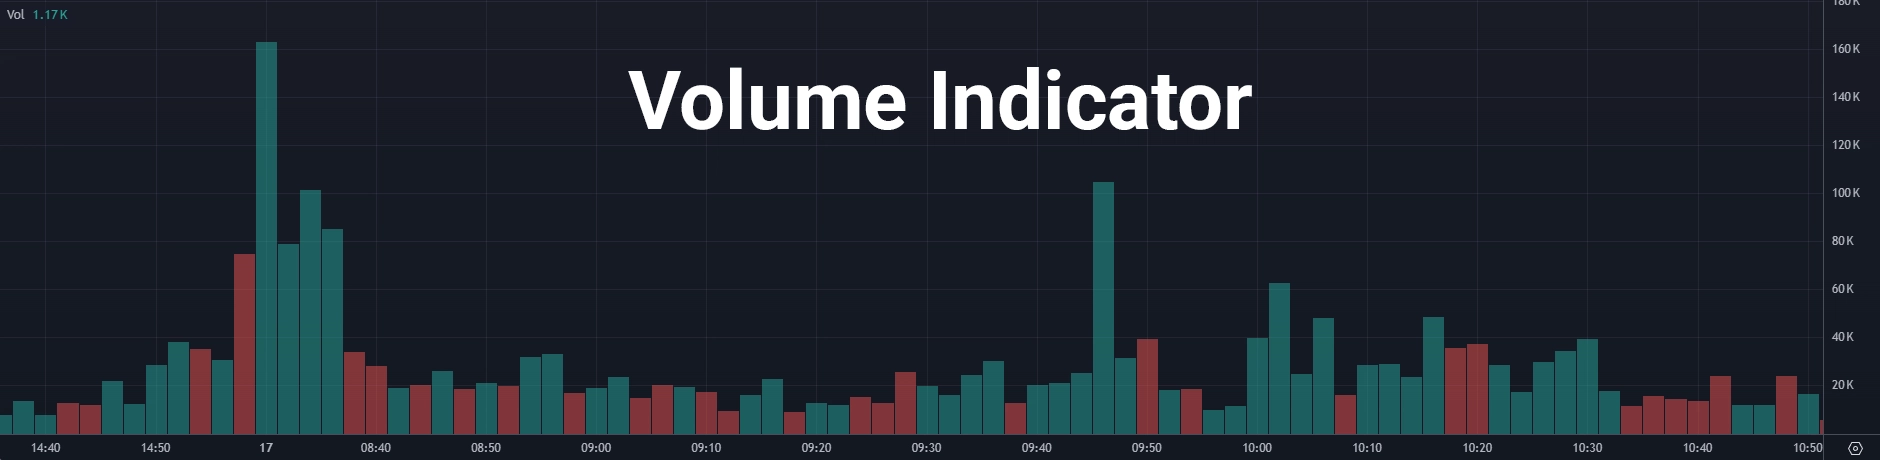
Volume Indicator showing spikes in volume.
2. VWAP: The King of Day Trading If I were forced to delete everything off my intraday chart and could only keep one tool, it would be the VWAP. VWAP stands for Volume Weighted Average Price. It is undeniably the most powerful of all day trading indicators.
Unlike simple moving averages, VWAP factors in volume. It tells you the true average price a stock has traded at since the market opened today, weighted by the amount of volume traded at each price level.
(Alt text: A 5-minute intraday chart displaying the VWAP day trading indicators acting as dynamic support)
Bullish: If the stock is above the VWAP, buyers are in control today. Dips to the VWAP line are often great places to buy.
Bearish: If the stock is below the VWAP, sellers are in control.
VWAP is heavily relied upon by algorithms and big banks to gauge execution quality, which is why the SEC frequently discusses VWAP in institutional trading rules.
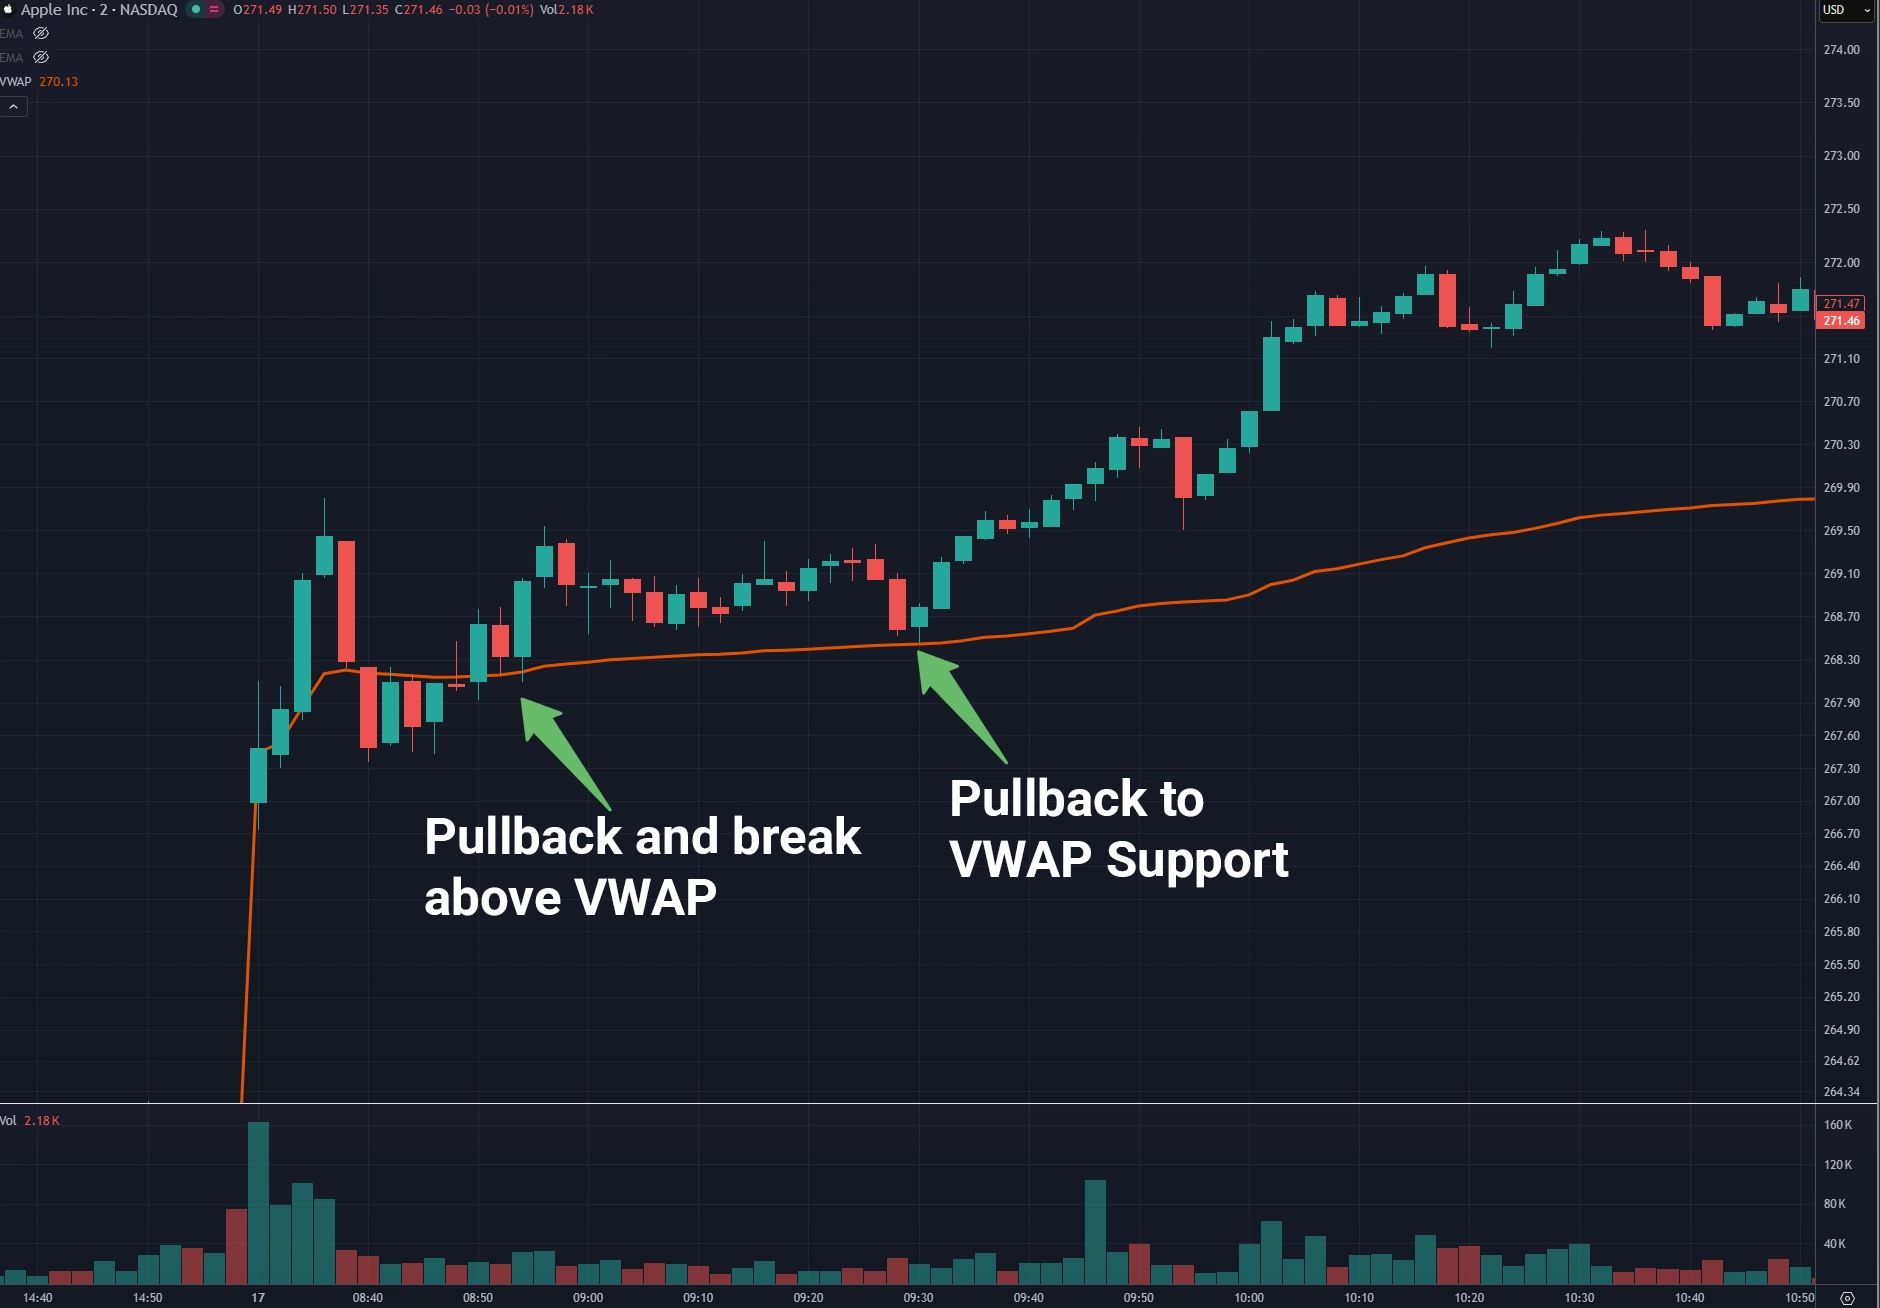
A 2-minute intraday chart displaying the VWAP day trading indicators acting as dynamic support.
3. The 9 and 20 Exponential Moving Averages (EMAs) Remember the 20, 50, and 200 SMAs from the daily chart? We leave those behind on the intraday chart. Instead, we use the 9 EMA and 20 EMA.
"EMA" stands for Exponential Moving Average. Unlike the simple version, an EMA puts more mathematical weight on the most recent price action. This makes the lines hug the current price much tighter and react much faster—which is exactly what you need when you're in a fast-moving day trade.
The 9 EMA is your fast momentum line. In a strong morning runner, the stock price will often "surf" right on top of the 9 EMA without breaking below it.
The 20 EMA is your short-term intraday support.
A fantastic beginner strategy is watching for the 9 EMA to cross above the 20 EMA, indicating a surge in immediate buying pressure. Want to master this specific setup? Check out our step-by-step tutorial on trading the EMA crossover strategy.
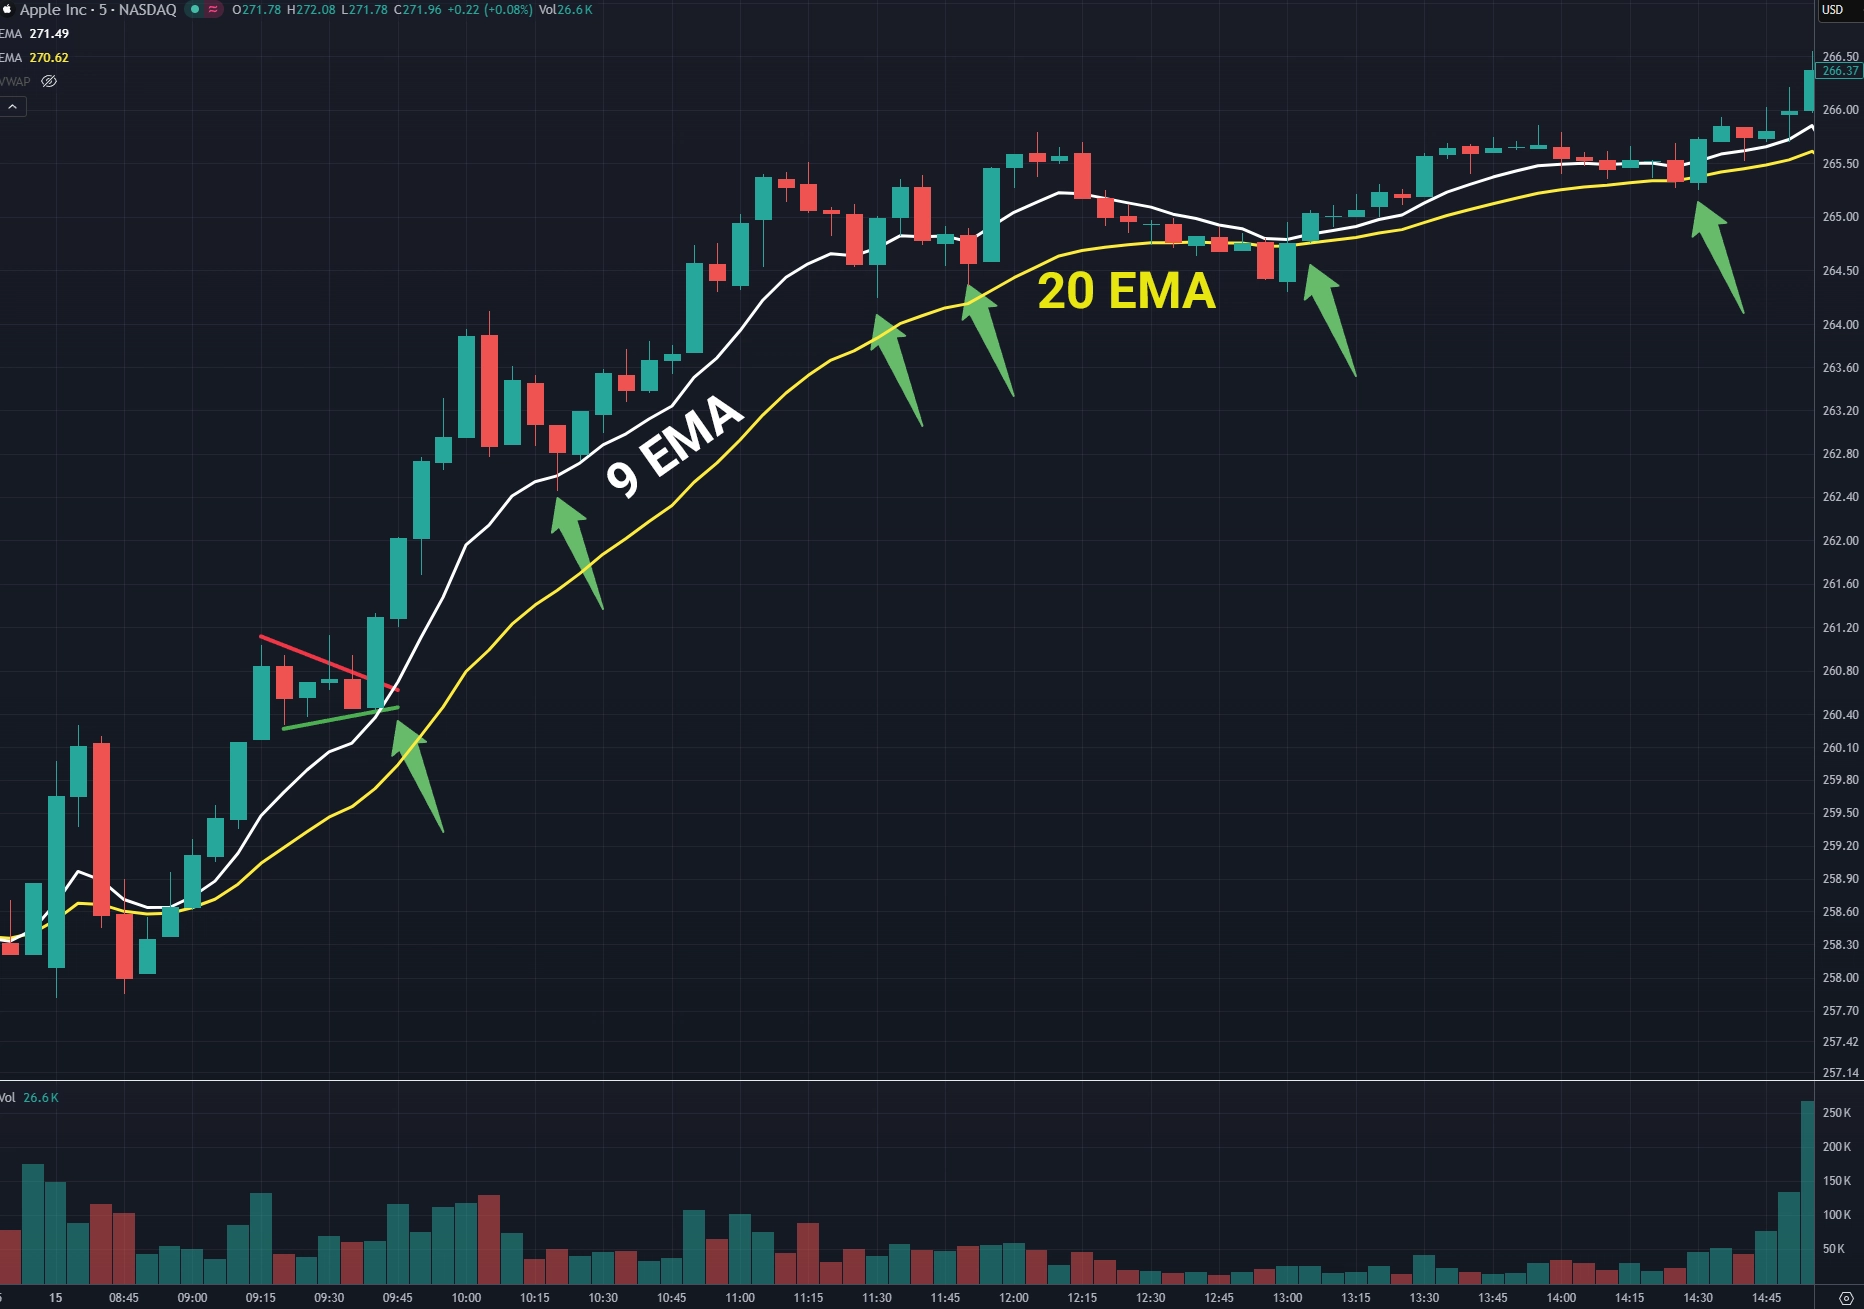
A stock chart showing the 9 EMA and 20 EMA plotted on the chart
Best Practices for Beginners Using Day Trading Indicators
Now that you have your Daily and Intraday charts set up beautifully, let's talk about how to use them without losing your mind—or your money.
Respect the Daily Trend First: Never fight the daily chart. If a stock is crashing through its 200 SMA on the daily chart, do not try to buy it on the 1-minute chart just because the 9 EMA crossed the 20 EMA. The big trend will almost always crush the small trend.
Indicators Are Not the Law: Always prioritize raw price action over your indicators. If a stock is ripping to the upside through major resistance, but your daily Stochastics says it's "overbought," don't step in front of that freight train to short it. Price is always king.
Manage Your Risk: All the day trading indicators in the world won't save you if you don't know how to cut your losses. Whenever you enter a trade based on a VWAP bounce or an EMA cross, know exactly where you will exit if you are wrong. Brush up on your safety nets by reading our guide on proper risk management and setting stop losses.
Summary of Your New Indicator Toolkit
Let’s do a quick recap of your new, streamlined charting setup:
Your Daily Chart (The Big Picture):
Volume: To confirm institutional interest.
20, 50, 200 SMAs: To identify the short, medium, and long-term macro trends.
Stochastics: To spot when a stock is getting historically overbought or oversold.
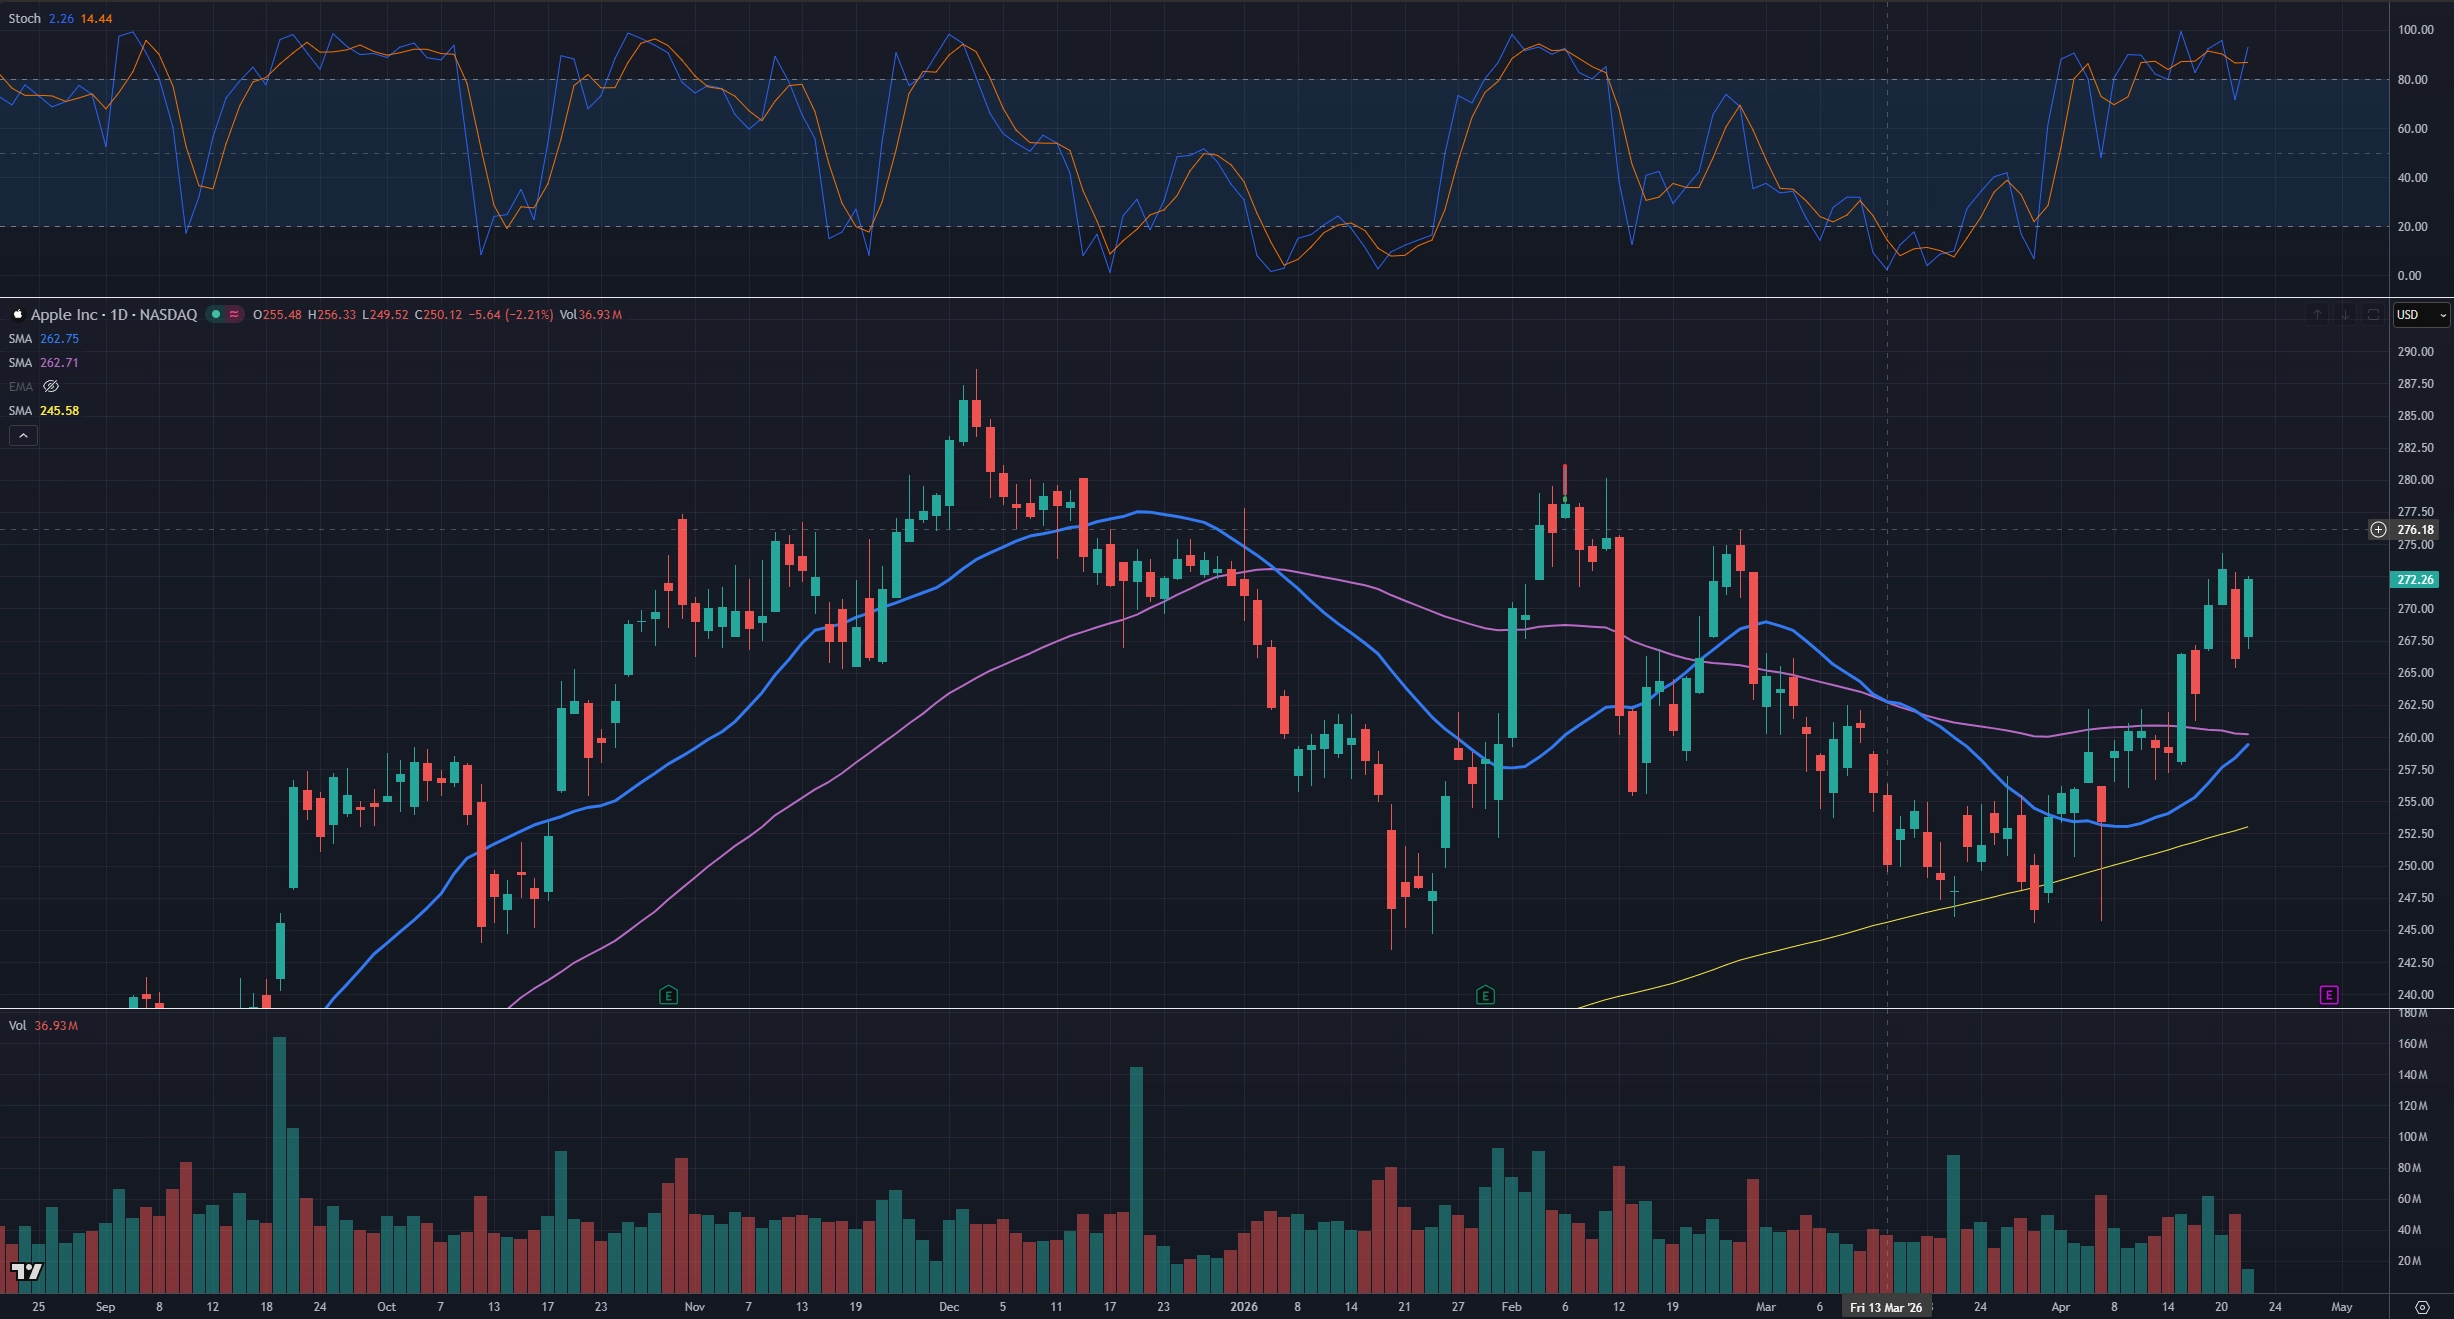
A daily stock chart layout with Moving Averages, Volume, and Stochastics plotted as indicators.
Your Intraday Chart (The Execution):
Volume: To confirm immediate, fast-paced buying or selling pressure.
VWAP: The ultimate daily anchor for deciding who is in control today.
9 and 20 EMAs: Your high-speed momentum trackers for pinpointing entries and exits.
Mastering this specific combination of day trading indicators will take some screen time, but once you learn their language, the stock market will stop looking like random chaos and start looking like a map full of very clear opportunities.
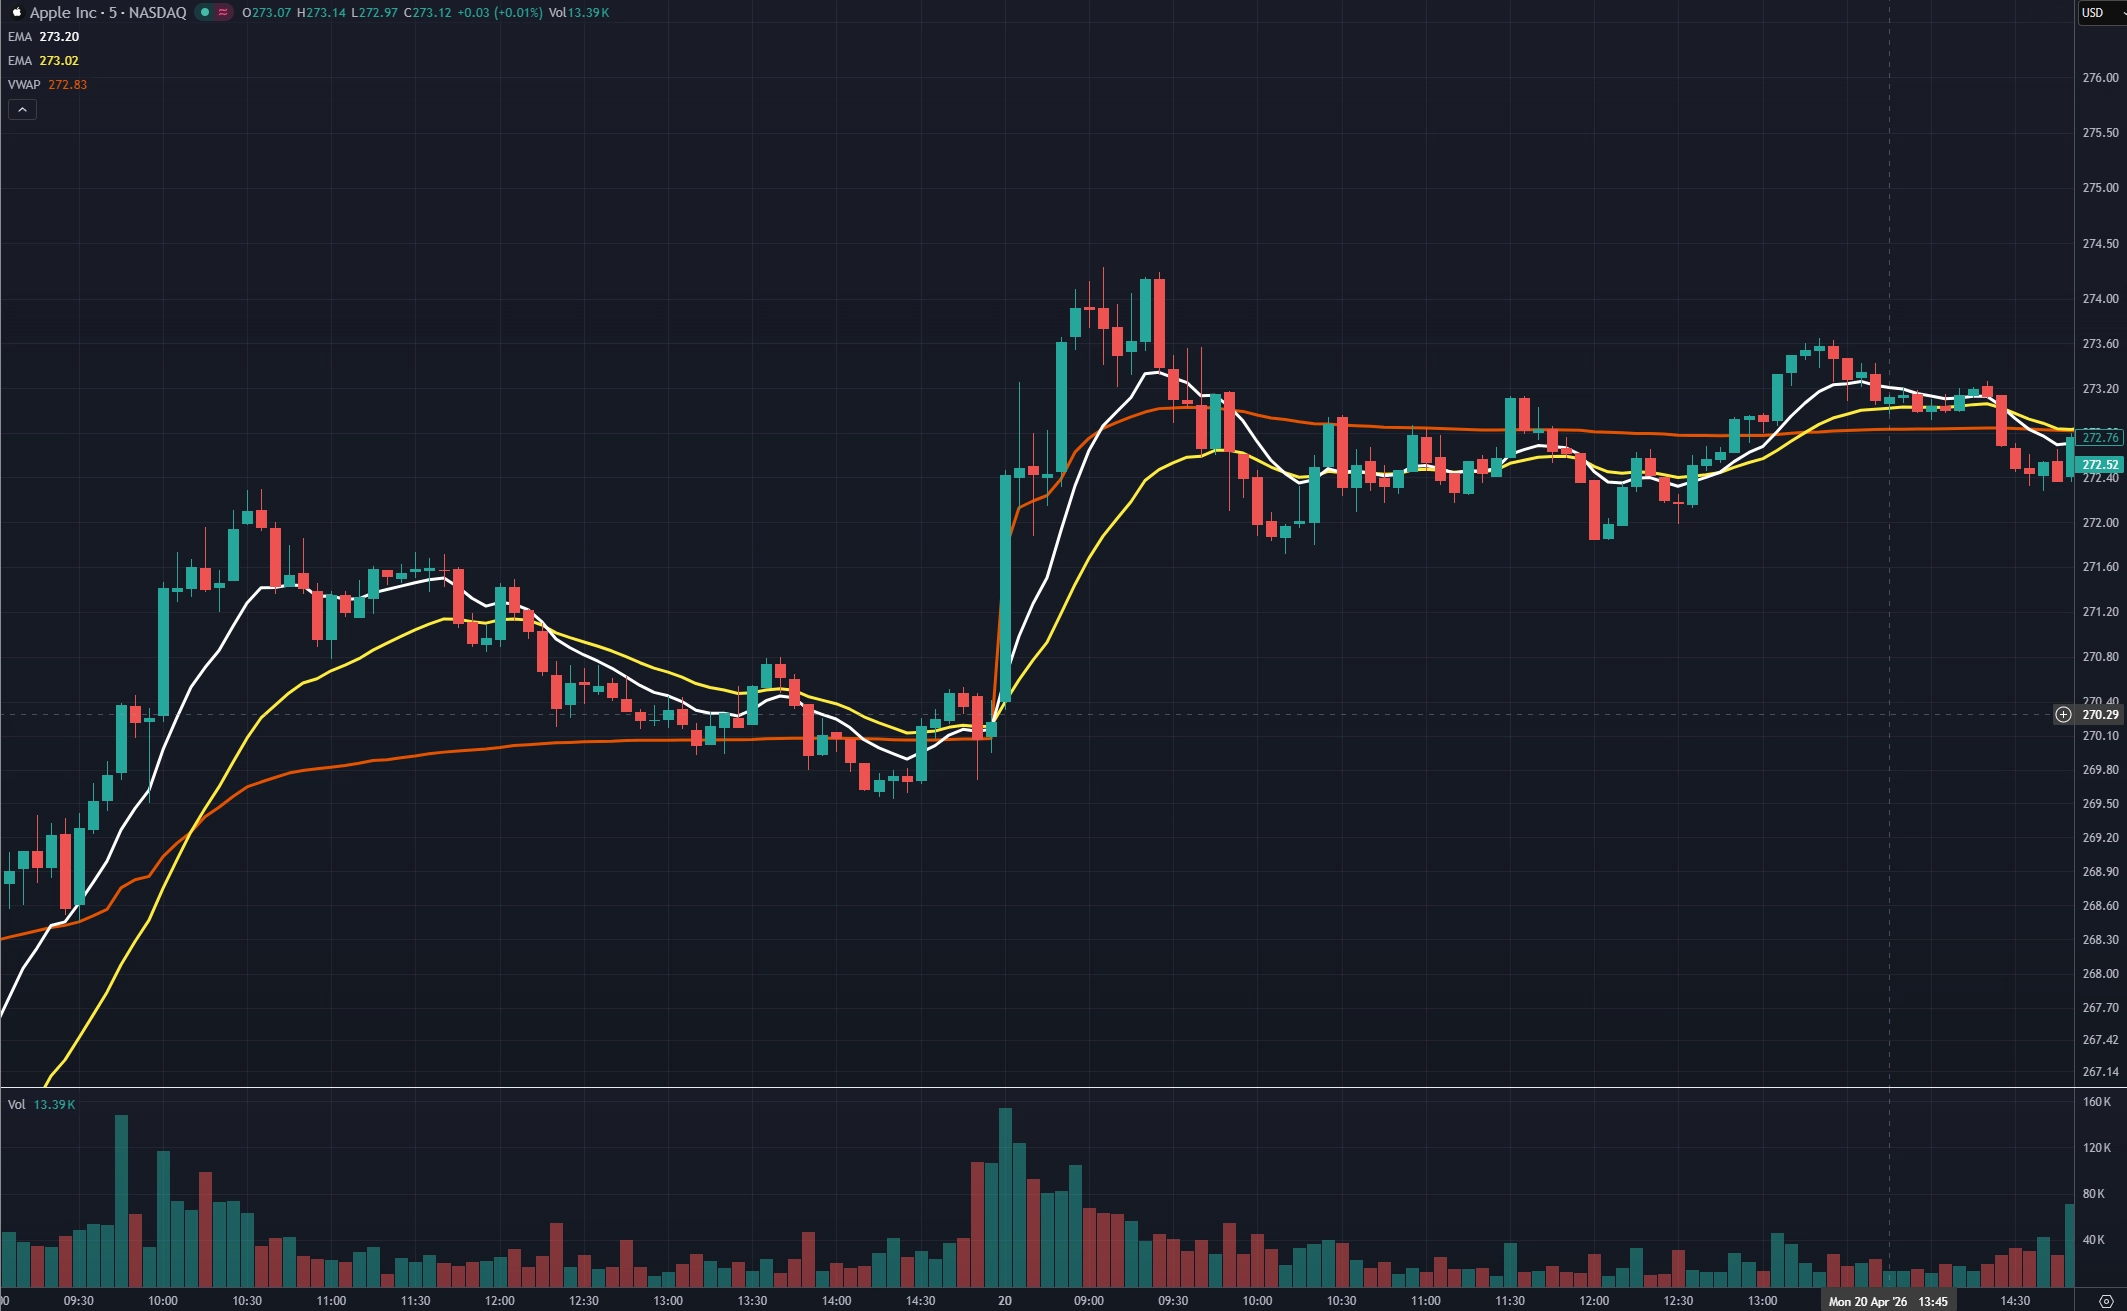
An intraday stock chart with Moving Averages, Volume, and VWAP plotted on the chart.
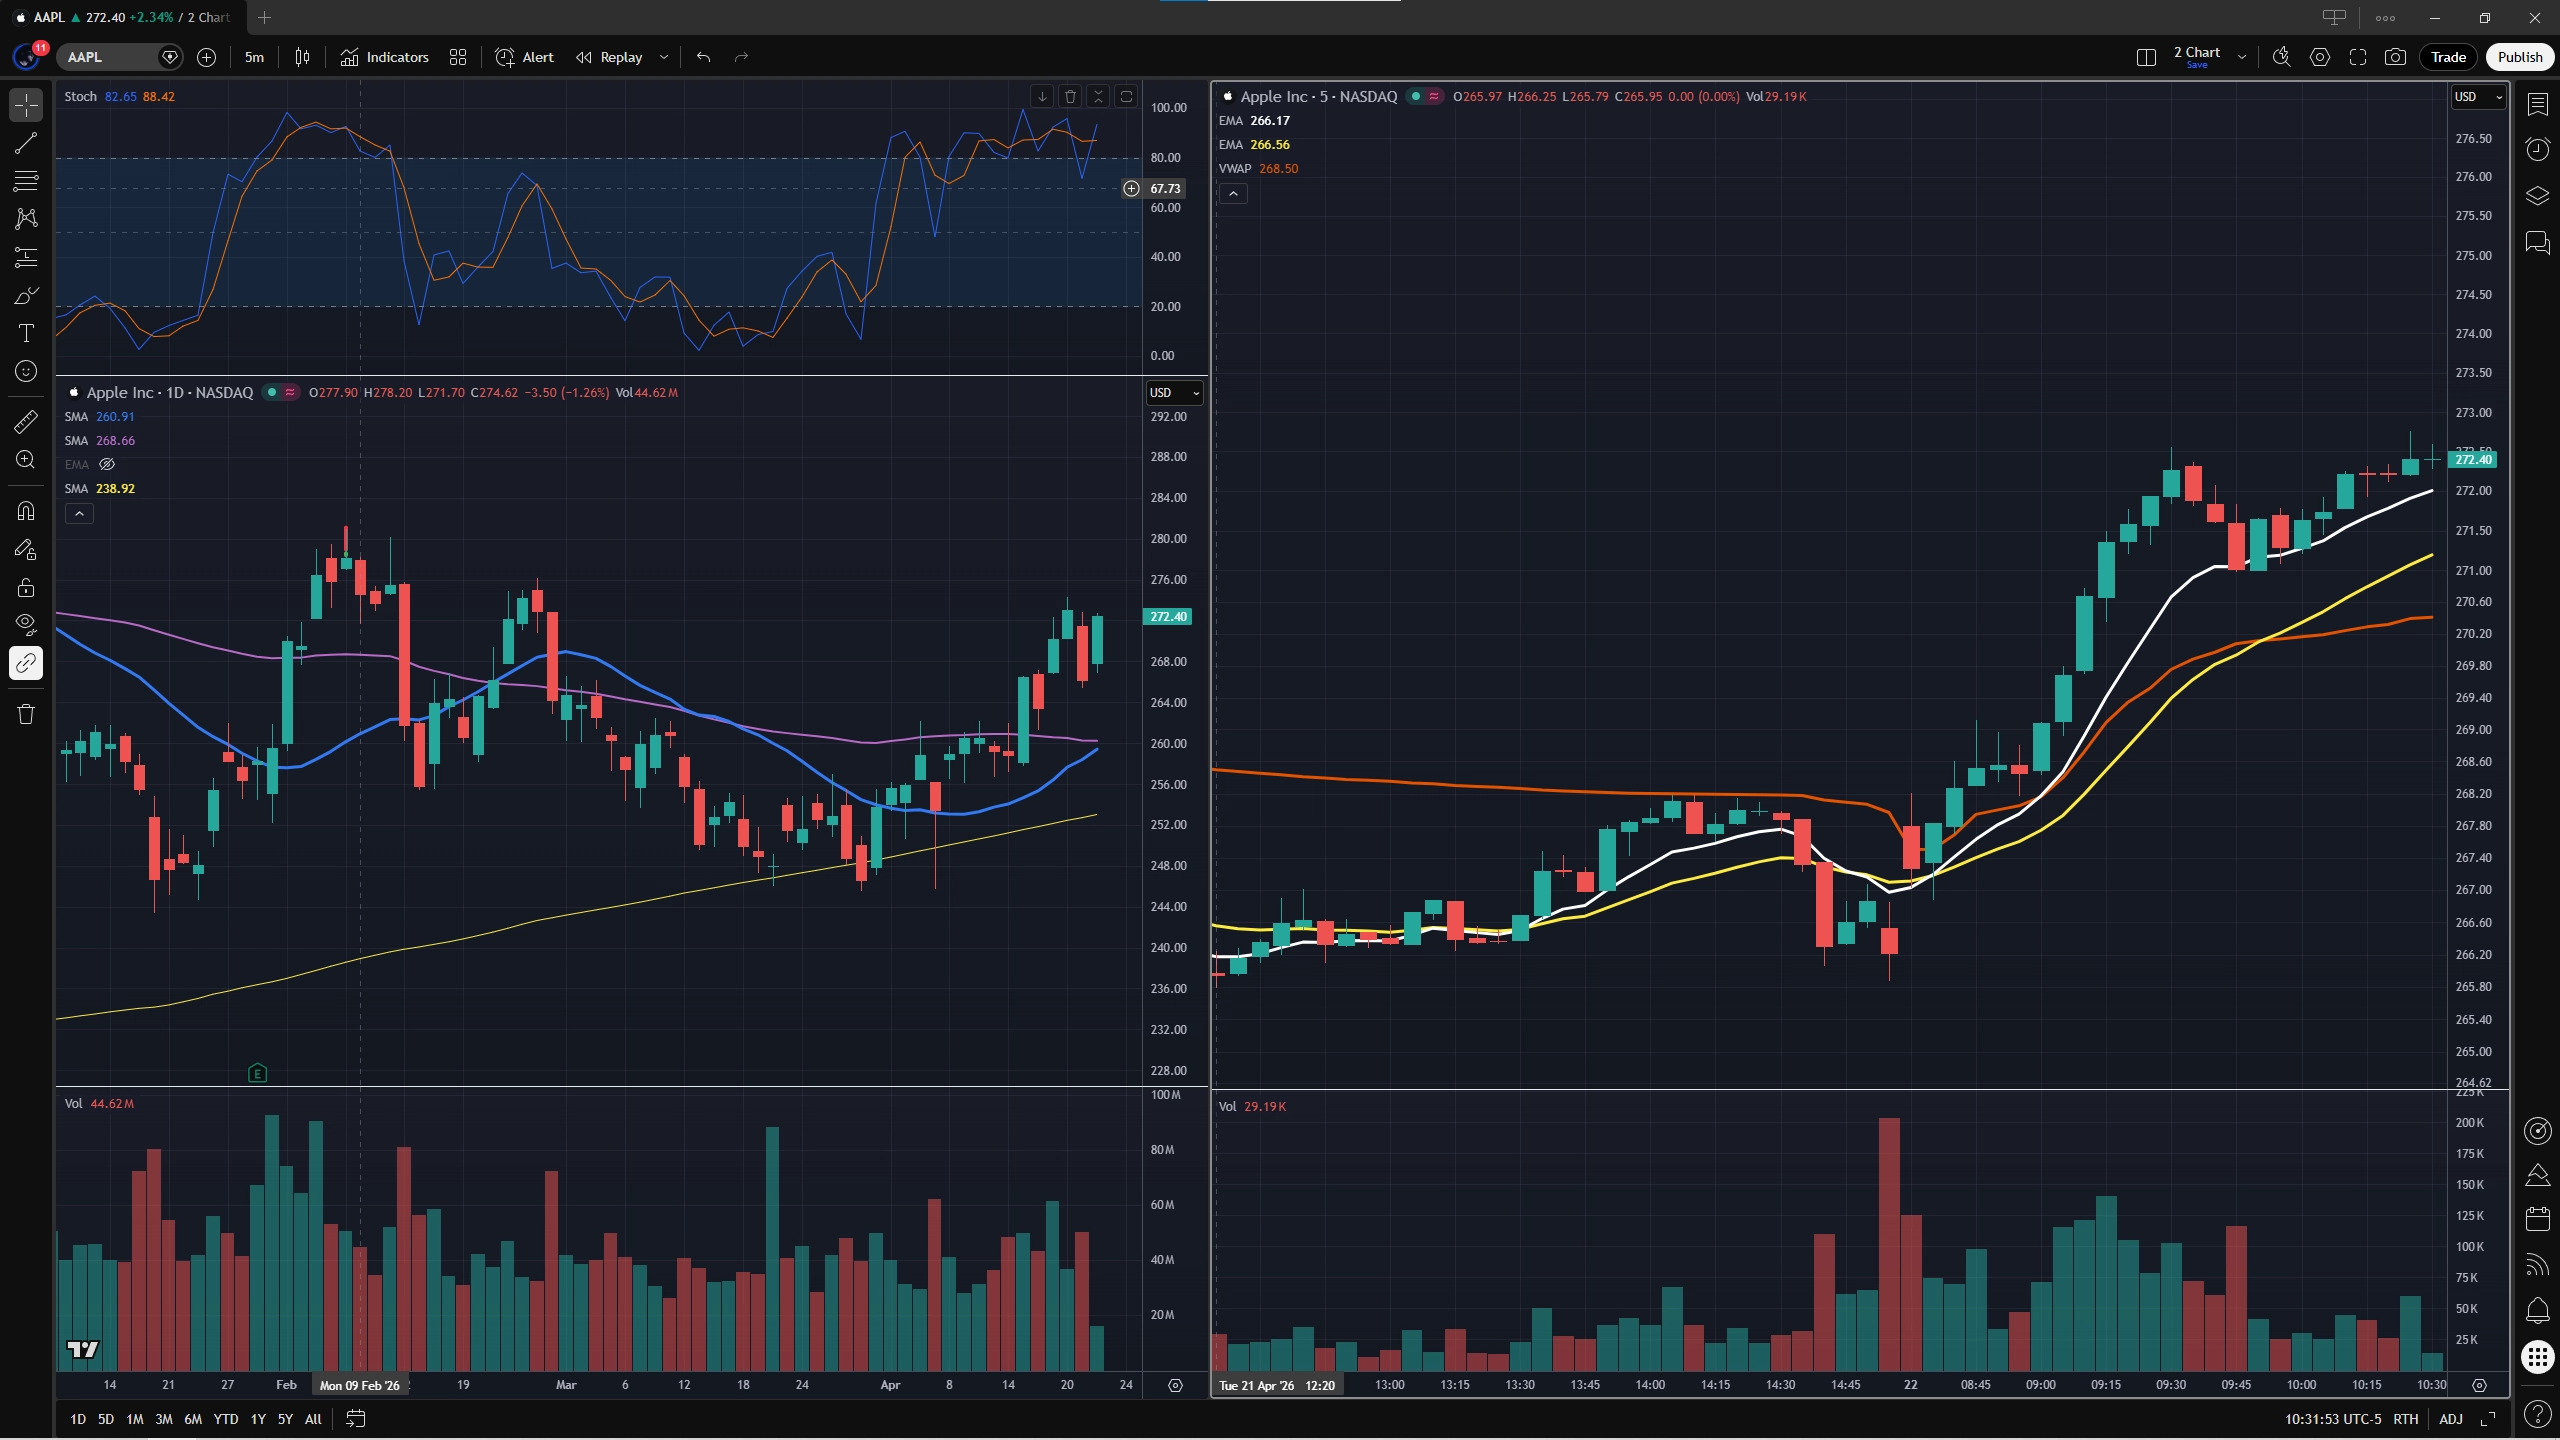
A complete Day Trading layout with the Daily and Intraday charts side by side.
Ready to Level Up Your Trading Game?
You don't have to figure out this complex market all by yourself. If you're ready to stop guessing and start trading with a real, structured edge, we are here to help you every step of the way. Let's get your daily and intraday charts dialed in, cut out the bad habits, and build a strategy that actually fits your lifestyle and goals.
Are you ready to become the trader you know you can be?
Contact us at: [832-429-5282]
Visit us at: [www.wallstreetsicarios.com]
Email us: [[email protected]]
Reach out today, and let's conquer the markets together!


