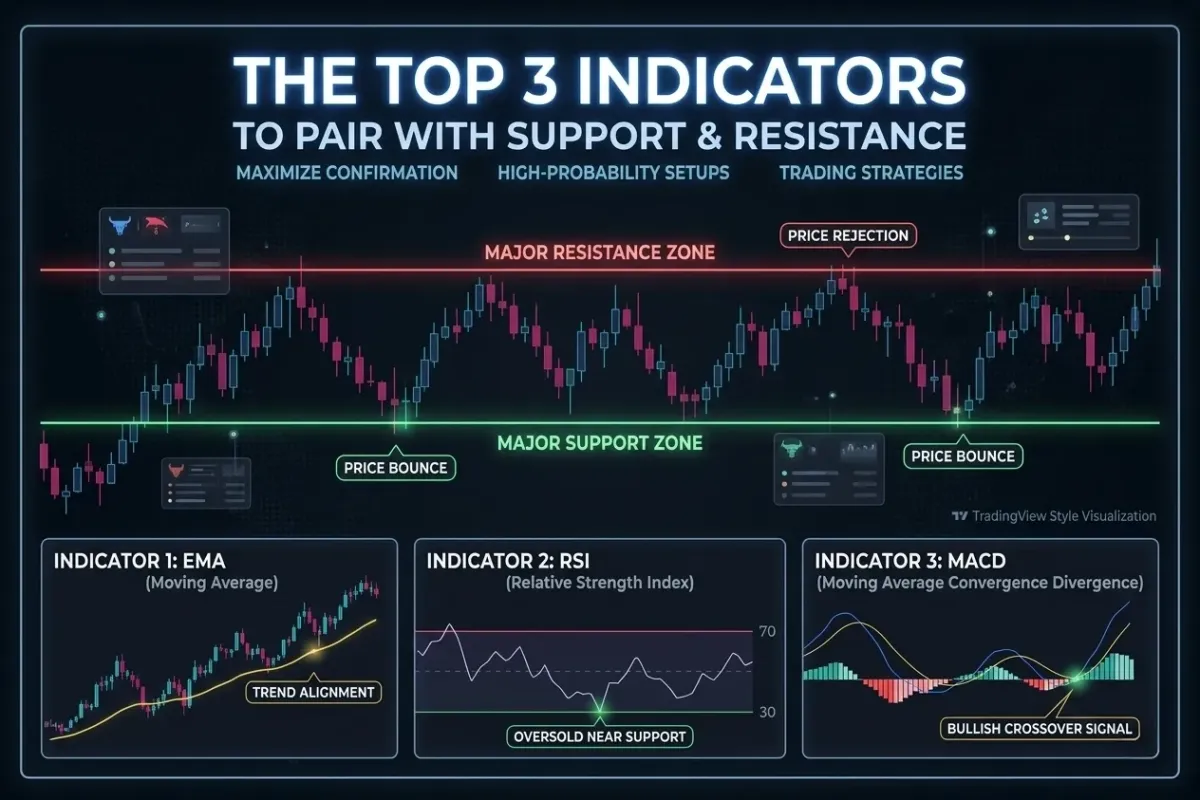
The Top 3 Trading Indicators to Pair with Support and Resistance
Hey there, trader! If you’ve been navigating the markets for more than a few days, you already know that Support and Resistance (S&R) are the absolute bread and butter of technical analysis. They act like the invisible floors and ceilings of the market, telling us where buyers are waiting to step in and where sellers are lurking in the shadows.
But let’s be totally honest with each other for a second—how many times have you bought at a "perfect" support level, only to watch the price crash straight through the floor and stop you out? Or shorted at resistance, only to get squeezed into oblivion? It happens to the best of us.
That’s exactly why trading naked price action can sometimes leave you vulnerable. To truly level up your win rate, you need a wingman. More specifically, you need the right Trading Indicators to confirm what the price action is telling you.
When you combine the structure of support and resistance with the data from the right Trading Indicators, you stop guessing. You start trading with confluence, which is just a fancy word for "multiple reasons to take the trade."
Today, we are going to dive deep into the top three indicators you need to pair with your horizontal levels to build a bulletproof trading strategy. Let's get into it!

Why Support and Resistance Need a Wingman
Think of support and resistance like a locked door in a video game. You know the door is there, but you don't know if the monsters behind it are going to bust it down, or if it's going to hold strong.
Horizontal levels on a chart only tell you where to look. They don't tell you what is actually happening under the hood when the price gets there. Are buyers exhausted? Are sellers accelerating? Is this a fakeout to trap retail traders?
This is where Trading Indicators come to the rescue. They measure the momentum, volume, and historical trends that the naked eye might miss. By layering these tools over your charts, you get a "look under the hood" of the market engine.
Check out our Ultimate Guide to Drawing Support and Resistance Levels] if you need a quick refresher on marking your charts correctly!
1. Volume: The Ultimate Lie Detector
If I could only choose one indicator to use for the rest of my trading career, it would be Volume. Volume isn't just an indicator; it’s the actual footprint of the big institutions and banks moving the market.
When you pair volume with support and resistance, you get the ultimate lie detector test for the market.
How to use it: Imagine a stock is falling rapidly and approaches a major support level. How do you know if it's going to bounce or break right through? Look at the volume bars at the bottom of your screen.
The Breakout / Breakdown: If the price breaks through support or resistance on massive, towering volume bars, that is a legitimate move. The big money has stepped in and decided that level is no longer valid. Don't fight it.
The Fakeout (The Trap): If the price peeks above resistance, but the volume is incredibly low and drying up, alarm bells should be ringing in your head. Low volume at a key level means there is no institutional interest in pushing the price higher. This is usually a trap set to catch eager breakout traders before the price reverses.
The Capitulation Bounce: If the price slams into support on huge volume, but the candlestick leaves a long wick (showing the price was pushed back up), that is a prime reversal signal. It means sellers threw everything they had at the floor, and buyers absorbed all of it.
Pro Tip: Don't just look at standard volume. Check out the Volume Profile (VPVR), which shows volume traded at specific price levels rather than just over time. You can learn more about how volume dictates market moves over at Investopedia’s Guide to Volume in Trading.
2. The Relative Strength Index (RSI): Your Exhaustion Gauge
Next up on our list of elite Trading Indicators is the Relative Strength Index, or RSI. The RSI is an oscillator that measures the speed and change of price movements. It fluctuates between 0 and 100, and it is a phenomenal tool for gauging when a market is running out of breath.

Usually, traders are taught that an RSI over 70 means a stock is "overbought" (time to sell) and under 30 means it is "oversold" (time to buy). But if you trade based purely on that, you're going to get burned during strong trends. Instead, you need to use RSI in context with your support and resistance levels.
How to use it: The true magic of the RSI reveals itself through a concept called Divergence.
Let’s say the price of Bitcoin is dropping, and it hits a major support zone at $60,000. It bounces a little, then drops again, making a lower low on the price chart at $59,000.
However, when you look down at your RSI, it made a higher low.
What does this mean? It's like a runner trying to sprint up a steep hill. They might still be moving forward (price making a lower low), but they are heavily out of breath and slowing down (RSI making a higher low). The momentum is fading.
When you see RSI bullish divergence forming exactly at a major support level, it is one of the highest-probability buy signals in all of technical analysis. The same is true for the reverse: bearish divergence at major resistance is a fantastic place to look for short entries.

(Struggling to manage your emotions when these setups appear? Read our Trader’s Psychology and Risk Management Masterclass to keep your mindset razor-sharp).
3. Moving Averages: The Dynamic Trend Filter
While horizontal support and resistance lines are static (they stay where you draw them), Moving Averages (MAs) are dynamic. They move with the price, smoothing out the noise to show you the true direction of the trend.
Among all the Trading Indicators out there, Moving Averages are the most widely used by institutional algorithms. For swing trading and day trading, the 50-period and 200-period Exponential Moving Averages (EMA) are absolute heavyweights.
How to use it: The golden rule of trading is "the trend is your friend until the end when it bends." Moving averages help you stay on the right side of that trend. But their real power unlocks when they line up perfectly with your drawn support and resistance levels. This is called Confluence.
Imagine you have a strong horizontal support line drawn at $150 on Apple’s daily chart. The price is pulling back toward $150. As you look at your chart, you notice that the 200 EMA is also curving right up to the $150 mark.
You now have two entirely different forms of support overlapping in the exact same spot:
The historical, horizontal floor.
The dynamic, algorithmic moving average.
When a horizontal level and a moving average intersect, it creates a concrete wall on your chart. These are the areas where you want to take your trades because your risk-to-reward ratio is incredibly skewed in your favor.
For a deeper dive into the math behind these averages, TradingView's breakdown of Moving Averages is a fantastic resource.
Bringing It All Together: The Ultimate Confluence Strategy
So, how do we actually trade this? Do we just slap all three Trading Indicators on our screen and hope for the best? Definitely not. A cluttered chart leads to a cluttered mind.
Instead, you want to build a step-by-step checklist. Here is a highly effective, approachable way to blend these tools:
Map the Battlefield: Zoom out to a higher timeframe (like the Daily or 4-Hour chart) and draw your major horizontal Support and Resistance zones. Do not look at any indicators yet. Just focus on pure price action.
Determine the Trend: Turn on your Moving Averages (50 EMA and 200 EMA). Are we in an uptrend or a downtrend? If the price is above the moving averages, only look for buying opportunities at support. If it's below, only look for shorting opportunities at resistance.
Wait for the Approach: Be patient. Let the price come to your pre-drawn levels. Don't chase the market in the middle of nowhere.
Check the Exhaustion Gauge (RSI): As price hits your support level, look at the RSI. Is it oversold? Better yet, is there bullish divergence forming? If yes, the setup is getting stronger.
Confirm with the Lie Detector (Volume): Watch the volume as the price hits your level. Are sellers drying up (low volume)? Or is a massive green bullish reversal candle forming on high volume? If the volume confirms the bounce, execute the trade.

(If you want to see exactly how we set up our screens for this strategy, take a look at our Ultimate Trading Setup Guide).
Summary: Level Up Your Trading Game
Trading doesn't have to be a guessing game, and you don't need a PhD in finance to be profitable. It all comes down to stacking the odds in your favor.
By starting with a solid foundation of Support and Resistance, and layering in the right Trading Indicators—Volume for confirmation, RSI for momentum and divergence, and Moving Averages for trend direction and dynamic confluence—you transform yourself from a reactive gambler into a calculated sniper.
Remember, no indicator works 100% of the time. The market is a beast of probability. But by waiting for these tools to align at key levels, you ensure that when you do take a shot, it’s the best possible setup available. Keep your risk tight, respect your stop losses, and trust the process.
Ready to Dominate the Markets? Let's Talk!
Are you tired of navigating the charts alone? At Wall Street Sicarios, we are dedicated to helping traders build real, actionable strategies that survive in any market condition. Whether you need help mastering these Trading Indicators, reading price action, or building an ironclad trading psychology, we've got your back.
Take the next step in your trading journey today!
📞 Contact us at: 832-429-5282
🌐 Visit us at: www.wallstreetsicarios.com
✉️ Email us for inquiries: [email protected]
Let's conquer the markets together. See you on the inside!
