Master Day Trading: How to Profit Using Support and Resistance Levels
Hey there! So, you’ve been watching the markets, seeing the tickers flash green and red, and you’re thinking, "I want in on this." You aren't alone. Day trading is one of the most exciting, fast-paced ways to engage with the financial world. But let’s be real for a second—it can also be a little intimidating if you don't have a roadmap.
Think of this post as a coffee chat with a friend who’s been in the trenches. We aren't going to drown you in Wall Street jargon that makes your eyes glaze over. Instead, we are going to focus on the absolute bread and butter of successful day trading: understanding support and resistance.
Many beginners treat the stock market like a casino, betting on a feeling or a "hot tip." But successful traders? They treat it like a business. They rely on structure. By the time you finish reading, you’ll have a clear, actionable strategy to approach day trading with confidence rather than guesswork.
What is Day Trading, Really?
Before we start drawing lines on charts, let’s get on the same page. Day trading is exactly what it sounds like: buying and selling financial instruments (like stocks, futures, or crypto) within the same trading day. The goal is to profit from small price movements. You aren’t marrying these stocks; you’re barely even dating them. You enter, take your profit, and get out before the closing bell rings.
The key to surviving in day trading is consistency. You don't need to hit a home run every time; you just need to get on base consistently. That is where support and resistance levels come into play. They act as your map in the chaotic world of the market.
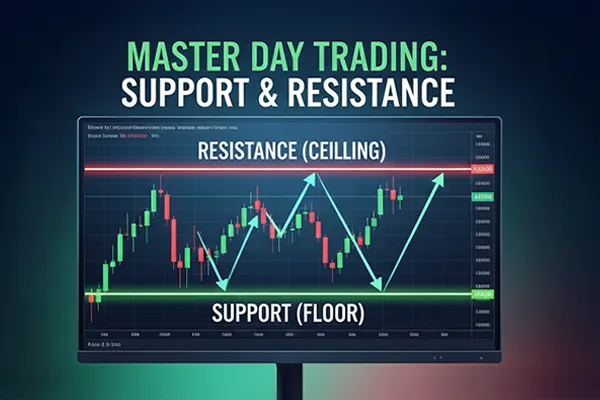
The Floor and The Ceiling: Understanding Support and Resistance
Imagine you are in a multi-story house bouncing a super ball. When you throw it down, it hits the floor and bounces up. When you throw it up, it hits the ceiling and comes back down.
In the world of day trading, charts work the same way.
Support (The Floor): This is a price level where a stock has difficulty falling below. It’s like there’s a safety net there. Buyers tend to step in at this level because they see value, pushing the price back up.

Resistance (The Ceiling): This is a price level where a stock struggles to go higher. Sellers step in here to take profits, pushing the price back down.

Why does this matter? Because if you know where the floor and ceiling are, you stop guessing. You know exactly where to enter a trade and, more importantly, where to get out.
How to Identify Key Levels for Day Trading
You don’t need a degree in mathematics to find these levels. You just need your eyes and a little practice. When you pull up a chart for day trading, look for the history. The market has a memory.
1. Look for the Touches Identify price points where the stock has reversed direction multiple times. If a stock hit $150 and bounced back up three times in the last week, $150 is a strong support level. The more times a price hits a level and reverses, the stronger that level is.

2. Use Multiple Time Frames Don't just stare at the 1-minute chart. That’s like looking at a blade of grass and trying to guess what the forest looks like. Zoom out to the 1-hour or 4-hour chart to see the "major" levels. Successful day trading requires knowing the bigger picture.

👉 How to Set Up Your Charts for Day Trading Success
3. Whole Numbers Matter There is a massive psychological element to trading. Humans love round numbers. A stock is much more likely to bounce off $100.00 than $100.13. These "psychological levels" often act as invisible support or resistance.
Note: "Support and resistance are zones, not exact lines." Prices might dip slightly below a line before bouncing. Don't be too rigid. I personally like to make my support and resistance lines very thick on my chart so that they take up more space and create a zone instead of a thin line.
The Two Core Strategies: The Bounce and The Break
Okay, you’ve drawn your lines. Now, how do you actually make money day trading with them? There are two main plays here that professional traders use every single day.
Strategy 1: The Reversal (Trading the Bounce) This is the classic approach. You are betting that the floor will hold.
Wait: Watch the stock approach a support level.
Confirm: Wait for a "confirmation candle"—a green candle showing that buyers are actually stepping in.
Enter: Buy the stock.
Exit: Sell as it approaches the resistance level (the ceiling).
Stop Loss: Place a stop loss just below the support level.

Strategy 2: The Breakout Sometimes, the ball is thrown so hard it breaks through the ceiling. When a stock price smashes through a resistance level with high volume, that old ceiling often becomes a new floor.

👉 Investopedia’s Guide to Support and Resistance
The Role of Volume in Day Trading
We touched on this briefly, but it deserves its own section. Volume is the fuel for the car. In day trading, volume confirms the move.
If a stock breaks through resistance on low volume, it’s likely a "fake-out."

If a stock bounces off support on high volume, it confirms that big buyers are defending that level.

Risk Management: The "Secret Sauce"
Here is the hard truth: You will lose trades. Even the best traders lose 30-40% of the time. The difference between a pro and a beginner is risk management. In day trading, your number one job is capital preservation.
The 1% Rule Never risk more than 1% of your total account on a single trade. Using support and resistance makes this easy. If you buy at support ($100) and set your stop loss at $99, you know exactly how much you are risking. Risking .5% is even better than risking 1%. Hope is not a strategy!
👉 5 Risk Management Rules Every Trader Must Follow
Managing Your Emotions (Trading Psychology)
You can have the best day trading strategy in the world, but if your head isn't in the game, you will fail. Fear and greed are your enemies. Sticking to your support and resistance rules helps remove emotion. You aren't making decisions based on how you feel; you are making decisions based on what the chart is telling you.
👉 Learn more about the mindset of a trader from CME's mini course.
Putting It All Together
Day trading is a skill that takes time, patience, and practice. By focusing on support and resistance, you are building a foundation on solid rock. If there was only one form of technical analysis I had to choose from, it would be support and resistance over all else.
👉 Top 3 Indicators to Pair with Support and Resistance
Ready to Take Your Trading to the Next Level?
We know that day trading can feel lonely and complex, but you don't have to do it alone. If you have questions about setting up your charts or understanding market structure, we are here to help.
Let’s connect:
Visit us at: wallstreetsicarios.com
Email for inquiries: [email protected]
Call us directly: (832) 429-5282
Custom HTML/CSS/JAVASCRIPT
